
What's More Valuable: Liquidity or Scarcity?
Card investors obsess over population counts. But how often a card actually trades may matter more.
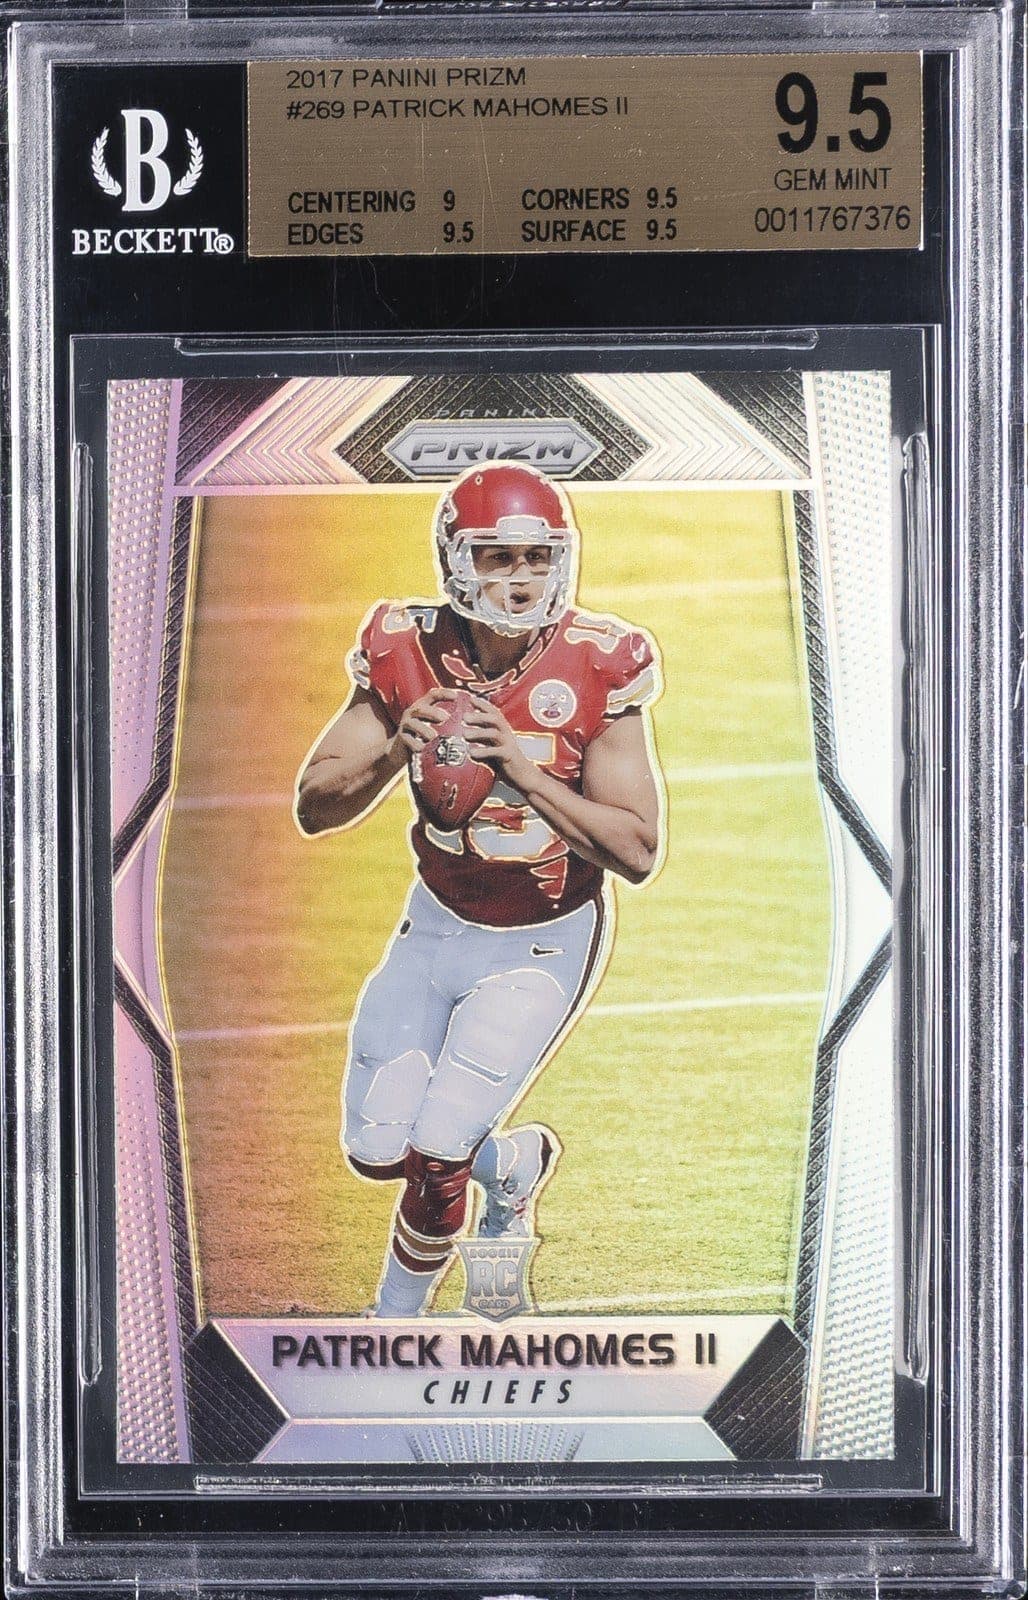
A card's population tells you how many copies exist. It does not tell you how many buyers show up on the day you want out. The sales record for Patrick Mahomes's 2017 Panini Select rookies holds two cards with almost the same graded supply.
Financial markets have priced that difference for decades. An asset that sells quickly, near its prevailing price and at low cost is worth more than one that takes weeks to move or a discount to clear. Yacov Amihud's 2002 paper built an illiquidity measure out of how much a stock's price moves per dollar traded, and found that investors demand a higher return for owning what is hard to sell.1
Cards have the same problem in a harder form. There is no central exchange, no continuous bid and ask, and no promise someone wants to buy on the day you want to sell.
Two Mahomes rookies with almost the same supply
| Card in PSA 10 (Professional Sports Authenticator) | Population | Sales, 90 days to Aug 25 | Sales ÷ population, unadjusted | Average sale | Latest sale |
|---|---|---|---|---|---|
| Mahomes, 2017 Select Field Level Silver #247 | 137 | 9 | 6.6% | $4,263 USD | $4,506 USD |
| Mahomes, 2017 Select Premier Level Silver #103 | 130 | 3 | 2.3% | $2,742 USD | $3,500 USD |
| Mahomes, 2017 Prizm base rookie | 985 | 46 | 4.7% | $7,246 USD | $7,975.50 USD |
| Allen, 2018 Optic Holo #154 | 297 | 12 | 4.0% | $1,879 USD | not recorded |
| Allen, 2018 Optic Orange /199 #154 | 47 | 1 | 2.1% | $2,400 USD | $2,400 USD |
Let's take the top 2 Mahomes in the table Nine buyers snagged Silvers over those three months. Only three took a Premier. The two cards have almost the same supply.23
The Field Level last sold for $4,506 USD on August 25, 2026, the Premier Level for $3,500 USD. Across the three months the Field Level sold at $4,263 USD on average and the Premier Level at $2,742 USD, a premium of about half.
None of that proves the trading frequency produced the premium. Field Level sits higher in Select's own hierarchy. Prestige pulls demand and price together on its own. An investor reading PSA supply alone would call these two cards interchangeable. The sale counts show two different markets.
A Field Level Silver sells about every ten days. A Premier Level Silver sells about every thirty.
The most common Mahomes has the most sales
Mahomes's 2017 Prizm base rookie carries more than seven times the graded supply of either Select Silver. It sold every two days across the window.4
The Prizm sold 46 times at $7,246 USD on average through August 25, 2026, about $333,000 USD in three-month volume. The Premier Level Silver sold three times, about $8,200 USD.
The Prizm moved roughly 40 times the dollar volume of the Premier Level Silver while carrying more than seven times the graded supply. The Prizm also costs 2.6 times as much on the three-month averages.
Brand explains part of that. Prizm is one of the defining modern football rookie brands, and Mahomes's 2017 Prizm has become a card the hobby covets. Recognition creates the demand. The demand creates the trading. A card that trades constantly is a card the market has agreed on.
The market pays for identity in other corners of the hobby. A jersey swatch with documented game use sells for many times what anonymous cloth sells for.
Population is not float
Population is total graded supply. Some copies sit in collections that will never sell, some owners have no intention of selling, and some copies come back to market again and again. Equity markets make that split between shares outstanding and the freely traded float. Card investors have no equivalent number.
The two Select Silvers have matching populations, 137 and 130. One sold nine times over those 90 days and the other three, so the supply that circulates does not match at all.
A low float can push a price up, because few owners will part with a copy. It can also leave an owner holding a card nobody is bidding on. One determined buyer can set a record. The next sale may not confirm it.
Low population on its own is not an investment case. Allen's Orange /199 has 47 copies in PSA 10 and sold once all summer.6
The last sale is not always a price you can get
A recent sale is only as good as the traffic behind it. The Mahomes Prizm sold 46 times in the 90 days to August 25, 2026 at a $7,246 USD average. That number describes a market. The Allen Orange sold once, at $2,400 USD.
The gap widens as cards get rarer. Some high-end cards go years between sales. A recorded price can be entirely legitimate and still say little about what the next seller would get.
Cards need a spread measure
A stock shows its liquidity in the order book. A bid of 99.90 a share against an ask of 100.00 is a liquid market. A bid of 80 against an ask of 120 is not. The gap between them is what a round trip costs.
Cards have no order book. They trade through auctions, fixed-price listings, private offers, dealers, shows and several marketplaces at once. No venue publishes what buyers are bidding against what sellers are asking. The closest substitute is how tightly recent sales cluster, once the market's direction is accounted for.
The Field Level Silver sold between $3,727 USD and $5,000 USD in the three months to August 25, 2026. The Allen Optic Holo sold between $1,700 USD and $2,000 USD. Measured against each card's own average, the Field Level's sales spread across 30% and the Holo's across 16%.25
A Holo changed hands about every 7.5 days, a Field Level about every ten.
One caution on reading a tight band. A range gets narrower as the sales inside it get fewer, whatever the market is doing.
What a liquidity read on one card would contain
- Transaction frequency. How often the same card in the same grade sells. Days between sales beats the date of the last sale.
- Dollar volume. 50 sales at 50 dollars each and 50 sales at 5,000 dollars each are both activity. They are not the same capital. Trailing 90-day and 12-month dollar volume belong beside the count.
- Execution dispersion. How tightly sales cluster once the market's direction is accounted for. Wide unexplained gaps mean the next sale is a guess.
- Market depth. How many copies are offered near fair value, across how many sellers and marketplaces. A sales history does not carry this.
- Float activity. Sales against population: This metric describes circulation at different scales.
137 copies graded PSA 10
9 sales, averaging $4,263 USD. The last was $4,506 USD
6.6% of the graded population, unadjusted for float
about $38,400 USD across those nine sales
one sale every 10.0 days on average
$1,273 USD between the high and low sales, 30% of the average. The Allen Optic Holo spreads across 16%
buyer count, seller count, marketplace count, live listings near fair value. None of it is published anywhere
The five figures do not have to collapse into one score. An investor can weight them however they like once someone puts them on the screen beside population.
How the premium should apply
The model does not need a claim that twice the trading is worth twice the price. Financial markets do not price it that way either. The usable form is a discount or premium applied to like-for-like value. A card with a deep sale history, a narrow spread and several active sellers earns a higher multiple. A card that trades twice a year takes a discount, because part of the stated value goes missing when the owner tries to exit.
The size of that adjustment should be measured rather than asserted. Someone with the full sales history could test it. Hold population, grade, product tier and player demand constant, then ask whether the faster-trading cards trade at higher multiples or hold value better in a drawdown.
What I would own
- Canonical cards with deep sale histories. Mahomes's 2017 Prizm in PSA 10 is one. A population of 985 reads as a disadvantage next to a numbered parallel. 46 sales price a card; one sale does not.
- Scarce cards that still turn over. The Select Field Level Silver #247 is the shape I want. A population of 137 is genuinely low, and nine sales in the window is a working market, one sale about every 10 days.
- Cards whose trading is growing. Rising sale counts, more marketplaces carrying the card and a tightening price range are early evidence that the market is adopting it. The evidence shows up before the price does.
I would be slower on cards whose whole case is a low population and a thin record. Tightly held assets can move hard when demand arrives. Until it does, the last sale is one data point. Yesterday's price is not today's price.
Collectors count supply and stop there
Collectors can tell you a card is numbered /199 and that 47 copies exist in PSA 10. They will still value it from the last sale, whenever that sale happened.
The same problem runs through Pokemon, Magic, Marvel, One Piece and Lorcana, where print run and population get quoted the same way. Supply in those markets is not fixed either. Nobody is running out of Charizards. A card with broad recognition and steady turnover supports a different market from an equally scarce card that rarely changes hands.
Ease of exit has a price.
Notes
- Yacov Amihud, "Illiquidity and stock returns: cross-section and time-series effects," Journal of Financial Markets, volume 5, 2002. Cited for the illiquidity measure and the finding that investors are paid to hold illiquid assets. We cite the paper itself rather than a link. ↩
- Card Ladder, 2017 Panini Select Patrick Mahomes Field Level Silver #247 in PSA 10: population 137, and 9 cited sales in the three months ending August 25, 2026, averaging $4,263 USD, ranging from $3,727 USD to $5,000 USD, latest $4,506 USD. cardladder.com ↩
- Card Ladder, 2017 Panini Select Patrick Mahomes Premier Level Silver #103 in PSA 10: population 130, and 3 cited sales in the same three months ending August 25, 2026, averaging $2,742 USD, latest $3,500 USD. cardladder.com ↩
- Card Ladder, 2017 Panini Prizm Patrick Mahomes base rookie in PSA 10: population 985, and 46 cited sales in the same three months ending August 25, 2026, averaging $7,246 USD, latest $7,975.50 USD. Card Ladder files this as Prizm (Silver) and notes it is the Prizm base rookie, because no non-refractor version of the card exists. cardladder.com ↩
- Card Ladder, 2018 Donruss Optic Josh Allen Holo #154 in PSA 10: population 297, and 12 cited sales in the same three months ending August 25, 2026, averaging $1,879 USD, ranging from $1,700 USD to $2,000 USD. The record we read carries no latest sale for this card. cardladder.com ↩
- Card Ladder, 2018 Donruss Optic Josh Allen Orange /199 #154 in PSA 10: population 47, and one cited sale in the same three months ending August 25, 2026, at $2,400 USD. cardladder.com ↩